
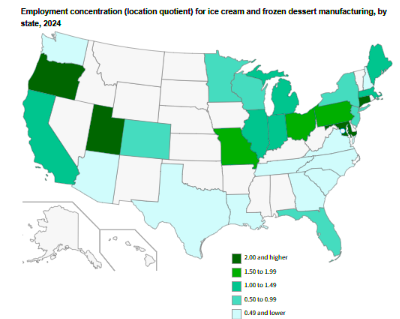
JEFFERSON CITY – July is National Ice Cream Month and data from the U.S. Bureau of Labor Statistics shows Missouri has the fifth highest concentration of ice cream and frozen dessert manufacturing employment, behind only Utah, Connecticut, Maryland, and Oregon.
With a location quotient of 1.86, employment in this industry is nearly twice as concentrated in Missouri compared to the rest of the nation.
At the Bureau of Labor Statistics, we celebrate with one of our coolest employment statistics, the location quotient. Just as an ice cream sundae must be prepared with certain proportions of specific ingredients according to a recipe (people learn this in sundae school), the location quotient is constructed with specific ratios according to a formula.
During 2024, employment in ice cream and frozen dessert manufacturing in the United States averaged 25,431. Total employment in all industries combined was 154,870,300. The ratio of ice cream manufacturing employment to total employment, in other words, 25,431 divided by 154,870,300, was 0.000164.
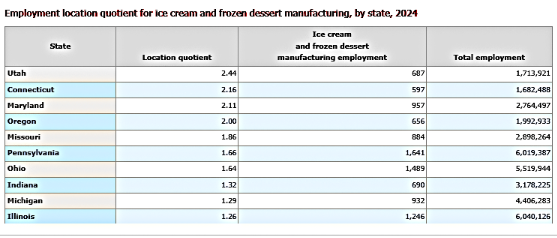
Let’s compare that with state data. In Utah, employment in this industry was 687, compared with total employment in Utah of 1,713,913, giving us a ratio of 0.000401.
Finally, and this is the cherry on top, we divide the ratio for Utah by the national ratio: 0.000401 ÷ 0.000164 = 2.44, which was the employment location quotient for this industry in this state. Location quotients over 1.00 mean that the industry’s share of employment in a state is higher than that industry’s share of employment at the national level.
We calculated this cool statistic for every state with ice cream manufacturing employment data available, and here’s the scoop: Utah’s location quotient was the highest. Other states with relatively high employment in ice cream manufacturing compared with their total employment include Connecticut, Maryland, and Oregon, all of which had location quotients of 2.00 or higher.
Looking just at employment, in 2024 there were six states that had employment over 1,000 in ice cream manufacturing: California, Pennsylvania, Ohio, Florida, Illinois, and New York. Location quotients in these states ranged from 0.65 in New York to about 1.65 in Pennsylvania and Ohio.
These delicious data are from the Quarterly Census of Employment and Wages.