
By Wilk Law Personal Injury & Accident Lawyers
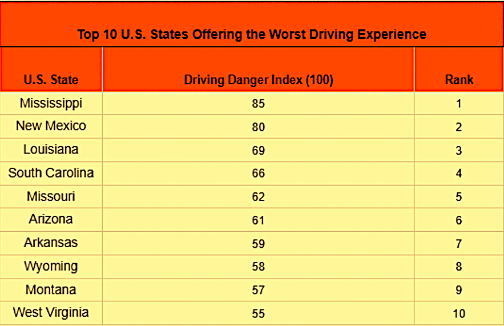
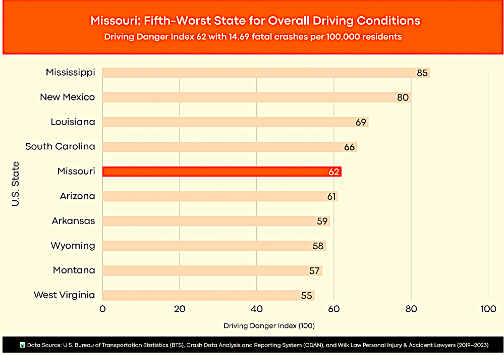
PHILADELPHIA, PA – The study shows that Missouri ranks fifth in poor driving conditions, with the highest rate of fatal crashes and one of the largest shares of roads in unacceptable condition.
The study shows that Missouri ranks fifth in poor driving conditions, with the highest rate of fatal crashes and one of the largest shares of roads in unacceptable condition.

The research by Wilk Law Personal Injury & Accident Lawyers analyzed data from the U.S. Bureau of Transportation Statistics (BTS) and the Crash Data Analysis and Reporting System (CDAN) covering the years 2019–2023. The study calculated each state’s Driving Danger Index (out of 100) by combining a Fatality Score (out of 60) and a Road Hazard Score (out of 40), based on average annual fatal crashes per 100,000 residents and the percentage of roads in unacceptable condition.
Missouri ranks fifth with a Driving Danger Index of 62 out of 100, which is 26.5% above the national average of 49. The Show-Me State scored a Fatality Score of 40 out of 60 and a Road Hazard Score of 22 out of 40. It recorded an average of 906 fatal crashes annually, equating to 14.69 fatal crashes per 100,000 residents, and 24.7% of road miles in unacceptable condition between 2019 and 2023.
Looking at the study, a spokesperson at Wilk Law Personal Injury & Accident Lawyers commented:
“The findings highlight the critical safety challenges drivers face in Missouri, where road quality is unacceptable and fatal crash rates are high.
Poor infrastructure combined with high crash rates significantly increases driver risk. By identifying the states with the most hazardous driving conditions, this study underscores the urgent need for road maintenance investments, stricter enforcement of traffic safety laws, and improved driver awareness.”
Methodology
The study analyzed data from the U.S. Bureau of Transportation Statistics (BTS) and the Crash Data Analysis and Reporting System (CDAN) covering the years 2019–2023. It examined each state’s average annual fatal crashes per 100,000 residents and the percentage of road miles in unacceptable condition. A Fatality Score (out of 60) and a Road Hazard Score (out of 40) were assigned to calculate the Driving Danger Index (out of 100), identifying the states offering the worst overall driving experience in the U.S.