
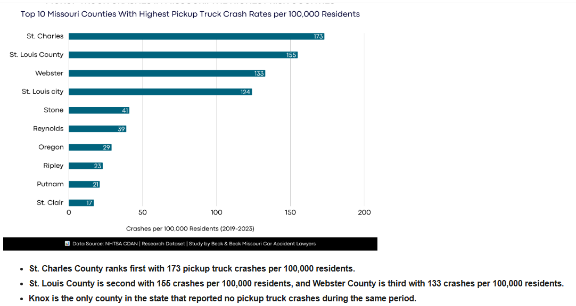
ST. LOUIS – A new study reveals that St. Charles County has the highest pickup truck crash rate in Missouri, far surpassing all other counties.
St. Charles County recorded 173 pickup truck crashes per 100,000 residents.
St. Louis County is second with 155 crashes per 100,000 residents, and Webster County is third with 133 crashes per 100,000 residents.
Knox is the only county in the state that reported no pickup truck crashes during the same period.
Ste. Genevieve was 95th on the list, with three pick up crashes for each 100,000 population.
Perry County was 48th with seven pick up crashes for each 100,000 population.
The research conducted by Missouri-based personal injury law firm Beck & Beck Missouri Car Accident Lawyers analyzed pickup truck crash records from 2019 to 2023 across all 115 counties in Missouri, reviewing five consecutive years of data to identify patterns and trends. For each county, the total number of pickup truck crashes per year was compiled, averaged over the period, and then standardized based on population size to calculate the rate per 100,000 residents.
St. Charles County ranks first with 173 pickup truck crashes per 100,000 residents, a staggering 1,342% higher than the Missouri state average of 12 pickup truck crashes per 100,000 residents. Between 2019 and 2023, the county’s average population was 4,156, with an average of 7.2 crashes yearly. The highest total came in 2021 with 10 crashes, while the lowest was six crashes in both 2019 and 2020.
St. Louis County ranks second with 155 pickup truck crashes per 100,000 residents, 1,192% above the state average of 12 pickup truck crashes per 100,000 residents. With an average population of 7,356, the county recorded 11.4 crashes per year between 2019 and 2023. The peak was 14 crashes in both 2019 and 2023, and the lowest was seven crashes in 2020.
Webster County ranks third with 133 pickup truck crashes per 100,000 residents, 1,008% higher than the statewide average of 12 pickup truck crashes per 100,000 residents. Between 2019 and 2023, the county had an average population of 1,960, reporting 2.6 crashes annually. The most dangerous year was 2021, with six crashes, while the safest were 2022 and 2023, with just one crash each.
Looking at the study, a spokesperson from Beck & Beck Missouri Car Accident Lawyers commented,
“The results show a troubling reality for counties like St. Charles, St. Louis, and Webster, where pickup truck crash rates are alarmingly higher than the state average.
“Pickup trucks are among the most common vehicles on Missouri’s roads, but the data make clear that drivers are at significantly greater risk in some counties. These findings highlight the need for continued investment in driver education, local road safety improvements, and targeted enforcement.”
St. Louis City ranks fourth with 124 crashes per 100,000 residents, 933% higher than the state average of 12 pickup truck crashes per 100,000 residents. With an average population of 5,987, the city recorded 7.4 crashes annually between 2019 and 2023. The highest total was 14 crashes in 2022, while the lowest was four in 2019.
Stone County ranks fifth with 41 crashes per 100,000 residents, 242% higher than the Missouri average of 12 pickup truck crashes per 100,000 residents. The county has an average population of 5,925 and recorded 2.4 crashes per year between 2019 and 2023. The highest total was four crashes in 2019 and 2023, while the lowest was zero crashes in 2020.
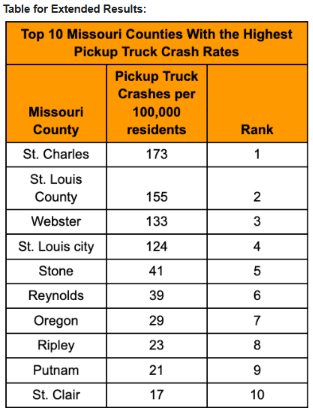
Reynolds (6th) had an annual average of 39 pickup truck crashes per 100,000 residents, followed by Oregon (7th) at 29, Ripley (8th) at 23, Putnam (9th) at 21, and St. Clair (10th) at 17.
Table for Extended Results:
The study was conducted by Beck & Beck, Missouri Car Accident Lawyers, an experienced law firm specializing in vehicle accident representation. They handle everything from initial claim evaluation to medical care coordination and aggressive negotiations with insurance companies.
Credit and link to https://becklawmo.com/
Methodology
The study analyzed pickup truck crash records from 2019 to 2023 across all 115 counties in Missouri, reviewing five consecutive years of data to identify patterns and trends. For each county, the total number of crashes in each year was compiled, averaged over the period, and then standardized based on population size to calculate the rate per 100,000 residents.
Data Sources:
Pickup Truck Crash Data → https://cdan.dot.gov/query
Research Dataset → https://docs.google.com/spreadsheets/d/1oHemCSmq5TN0FmRM_c03FfbK9h56cc8BmKJ3ghrOn5U/edit?gid=0#gid=0
Study By → https://becklawmo.com/