
KANSAS CITY – Prices in the Midwest Region, as measured by the Consumer Price Index for All Urban Consumers (CPI-U), advanced 0.3% in August, the U.S. Bureau of Labor Statistics reported today. The all items less food and energy index increased 0.2%, led by rising prices for apparel. The index for food advanced 0.7%, while the index for energy was up 0.2% over the same period.
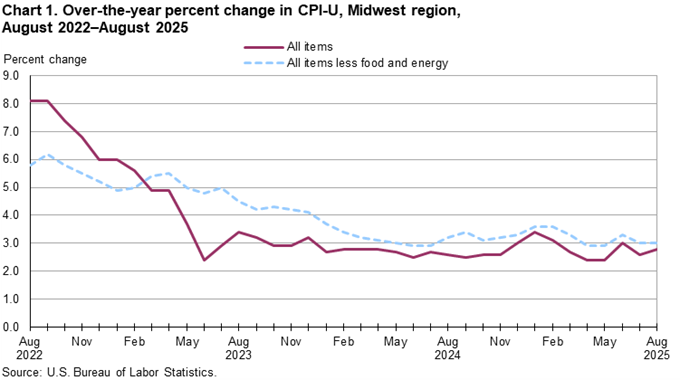
Over the last 12 months, the CPI-U rose 2.8%. The index for all items less food and energy advanced 3.0% over the year, and food prices rose 3.2%. Energy prices fell 0.3%, with declining prices for gasoline being the main contributing factor. (See chart 1.)
Food
The index for food advanced 0.7 percent in August. The index for food at home (grocery store purchases) rose 1.0 percent, with higher prices seen in all six of the major grocery store food groups. The index for food away from home (restaurant, cafeteria, and vending purchases) was up 0.3 percent for the same period. Within the food at home category, the indexes for fruits and vegetables (+2.4 percent) and meats, poultry, fish and eggs (+1.5 percent) contributed most to the increase.
Over the year, the food index rose 3.2 percent. The index for food at home advanced 3.0 percent, and prices for food away from home were up 3.6 percent. While all six major grocery store food indexes increased in the past year, a 6.1-percent rise in the meats, poultry, fish and eggs index led these advances.
Energy
The energy index rose 0.2 percent over the month. The indexes for gasoline and electricity both increased, up 1.5 percent and 0.3 percent, respectively. The index for natural gas service fell 3.1 percent for the same period.
The index for energy declined 0.3 percent from August 2024 to August 2025, almost entirely due to a decrease in the gasoline index (-8.6 percent). In contrast, indexes for natural gas service (+13.3 percent) and electricity (+7.2 percent) both increased over the year.
All items less food and energy
The index for all items less food and energy rose 0.2 percent in August. Among the component indexes, increases were led by apparel (+2.9 percent), owners’ equivalent rent of residences (+0.3 percent), and recreation (+0.5 percent). In contrast, the index for household furnishings and operations (-0.3 percent) declined over the month.
The index for all items less food and energy advanced 3.0 percent over the year. A 4.7-percent rise in the owners’ equivalent rent of residences index was the major contributing factor in component increases. The indexes for medical care services (+3.6 percent), rent of primary residence (+4.8 percent), and household furnishings and operations (+4.8 percent) also contributed to the rise. The index for lodging away from home declined over the 12-month period.