
KANSAS CITY – The Consumer Price Index for All Urban Consumers (CPI-U) in the St. Louis area advanced 0.5 percent for the two months ending in February 2025, the U.S. Bureau of Labor Statistics reported.
Assistant Commissioner for Regional Operations Michael Hirniak noted that prices for all items less food and energy increased 0.4 percent. The index for food rose 0.9 percent, while the index for energy declined 0.5 percent over the two-month period. (Data in this report are not seasonally adjusted. Accordingly, bi-monthly changes may reflect seasonal influences.)
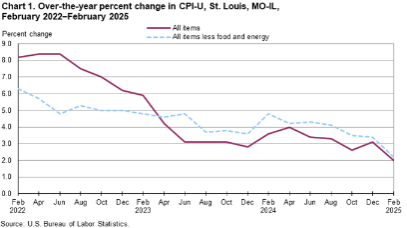
The St. Louis area all items CPI-U advanced 2.0 percent for the 12 months ending in February. The index for all items less food and energy increased 2.2 percent over the year, and food prices rose 2.4 percent. Energy prices fell 1.5 percent for the same period.
Food
Food prices were up 0.9 percent for the two months ending in February.
Prices for food at home (grocery store purchases) rose 0.9 percent, and prices for food away from home (restaurant, cafeteria, and vending purchases) increased 0.8 percent for the same period.
Within the food at home index, the indexes for cereals and bakery products (+4.3 percent), meats, poultry, fish, and eggs (+2.6 percent), and fruits and vegetables (+1.7 percent) contributed to the rise.
Food prices increased 2.4 percent over the year.
Prices for food away from home advanced 3.5 percent, and prices for food at home rose 1.6 percent. The index for meats, poultry, fish, and eggs and the index for fruits and vegetables were both up 6.1 percent over the same period.
Energy
The energy index decreased 0.5 percent for the two months ending in February. Gasoline prices increased 2.4 percent over the same period.
From February 2024 to February 2025, energy prices fell 1.5 percent. The index for gasoline declined 2.4 percent.
All items less food and energy
The index for all items less food and energy increased 0.4 percent during the two-month period. Among index components, prices were higher for apparel (+6.4 percent), recreation (+1.6 percent), and medical care (+0.9 percent). In contrast, prices were lower for public transportation, owners’ equivalent rent of residence (-0.2 percent), and rent of primary residence (-0.9 percent).
The index for all items less food and energy advanced 2.2 percent over the year.
Components contributing most to the increase included owners’ equivalent rent of residence (+4.2 percent), rent of primary residence (+5.0 percent), and motor vehicle maintenance and repair. In contrast, prices were lower for education and communication (-4.5 percent) and apparel (-3.4 percent).