
KANSAS CITY — Prices in the Midwest Region, as measured by the Consumer Price Index for All Urban Consumers (CPI-U), advanced 0.8 percent in January, the U.S. Bureau of Labor Statistics reported Thursday.
Increases in the indexes for food at home, new and used motor vehicles, household furnishings and operations, and apparel were the largest contributors to the all items increase.
The energy index rose 0.1 percent in January as increases in the indexes for electricity and gasoline more than offset a decline in the natural gas service index. (Data in this report are not seasonally adjusted. Accordingly, month-to-month changes may reflect seasonal influences.)
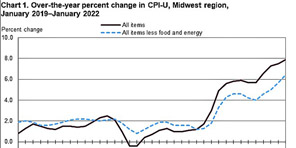
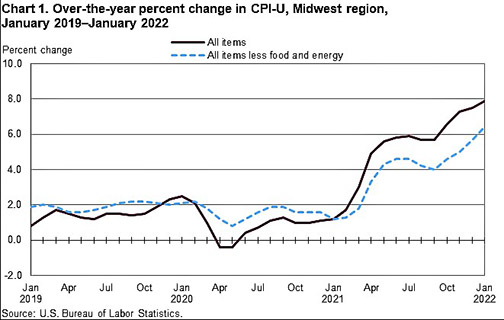
Over the last 12 months, the CPI-U rose 7.9 percent. The index for all items less food and energy rose 6.4 percent over the year. Energy prices rose 25.0 percent, largely the result of an increase in the price of gasoline. Food prices rose 8.0 percent.
Food
The food index advanced 1.1 percent for the month of January. Prices for food at home increased 1.9 percent, and prices for food away from home declined 0.3 percent for the same period.
Over the year, food prices rose 8.0 percent. Prices for food at home increased 8.5 percent since a year ago, and prices for food away from home increased 7.1 percent.
Energy
The energy index rose 0.1 percent over the month. The increase was mainly due to higher prices for electricity (1.5 percent) and to a lesser extent, a 0.2 percent increase in gasoline prices. Costs for natural gas service declined 1.9 percent in January.
Energy prices increased 25.0 percent over the year, largely due to higher prices for gasoline (37.2 percent). Prices paid for natural gas service rose 31.1 percent, and prices for electricity increased 4.4 percent during the past year.
All items less food and energy
The index for all items less food and energy rose 0.8 percent in January. Higher prices for new and used motor vehicles (1.3 percent), household furnishings and operations (1.7 percent), and apparel (3.3 percent) were major contributors.
Over the year, the index for all items less food and energy rose 6.4 percent. Components contributing to the increase included new and used motor vehicles (24.8 percent), shelter (4.6 percent) and household furnishings and operations (11.6 percent).