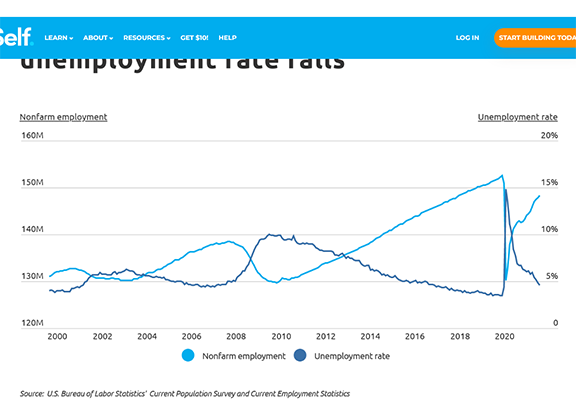
AUSTIN, Tex. — Since the short pandemic-induced recession of 2020, the job market has recovered quickly. At the onset of the pandemic, the U.S. lost over 22 million jobs, but according to the most recent data from the Bureau of Labor Statistics, nonfarm employment is currently just 4.2 million lower than pre-pandemic levels. While monthly job gains have not been steady, employment in October of 2021 was 5.8 million (4.1 percent) higher than a year ago.
Compared to the Great Recession precipitated by the collapse of the housing market in 2008, the economic contraction resulting from COVID-19 was both shorter and more severe. During the Great Recession, nonfarm employment fell by nearly 6 percent and the unemployment rate rose from 5 percent to 10 percent, which at that point was the highest rate since 1983. It took nearly seven years for these top-level job metrics to fully recover.
The official COVID-19 recession, on the other hand, lasted just two months, making it the shortest downturn on record, but also one of the deepest. In just two months, the unemployment rate rose from 3.5 percent to 14.8 percent and total employment dropped from 152 million to 130 million (or approximately 14.5 percent). Today, less than two years after the start of the pandemic, total employment is just 2.8 percent below the pre-pandemic peak.

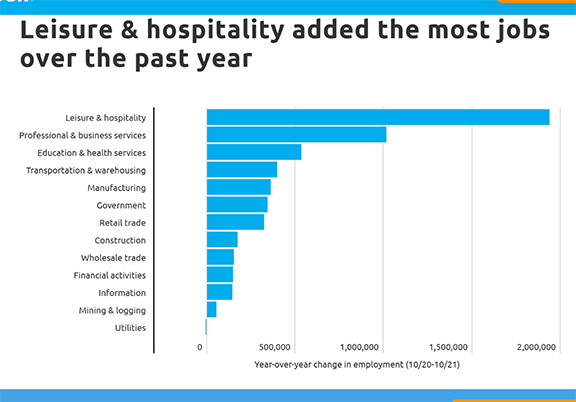
The COVID-19 pandemic impacted some industries—especially those dependent on face-to-face interactions—far more than others. However, over the past year, every sector except utilities gained jobs back. Leisure and hospitality, one of the hardest hit during the pandemic, added the most jobs between October 2020 and 2021. After shedding nearly 50 percent of its workforce at the start of the pandemic, the sector grew more than 14 percent in 2021, adding nearly 2 million jobs. Other sectors that added the most jobs in 2021 include professional and business services, education and health, and transportation and warehousing.

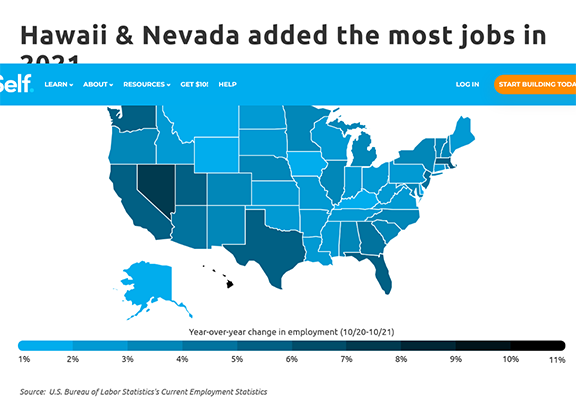
On a regional level, the West Coast experienced the largest employment gains over the past year. Hawaii, whose tourism-dependent economy was disproportionately hurt by the pandemic, leads the country in job gains from October 2020 to October 2021 with a 10.5 percent increase in nonfarm employment. However, total nonfarm employment in the state is still 12.9 percent below pre-pandemic levels. Similarly, Nevada—which is also highly dependent on tourism—increased its employment by 7.6 percent from a year ago and remains about 5.5 percent below its pre-pandemic peak.

To find the states with the most job gains in 2021, researchers at Self Financial analyzed the latest employment data from the U.S. Bureau of Labor Statistics. The researchers ranked states according to the percentage change in employment from October 2020 to October 2021. Researchers also included the total change in employment, total employment, and the unemployment rate.
The analysis found that during the study period, Illinois experienced a +3.4 percent change in total employment, compared to the +4.1 percent change for the country as a whole. Here is a summary of the data for Illinois:
- Percentage change in employment (YoY): +3.4 percent
- Total change in employment (YoY): +190,300
- Total employment (October 2021): 5,856,100
- Unemployment rate (October 2021): 5.0 percent
For reference, here are the statistics for the entire United States:
- Percentage change in employment (YoY): +4.1 percent
- Total change in employment (YoY): +5,774,000
- Total employment (October 2021): 148,319,000
- Unemployment rate (October 2021): 4.6 percent
For more information, a detailed methodology, and complete results, you can find the original report on Self Financial’s website:
https://www.self.inc/blog/cities-with-the-most-job-gains-and-losses-in-2021
