
KANSAS CITY — The Mountain-Plains Information Office of the U.S. Bureau of Labor Statistics today released Consumer Expenditures for the St. Louis Metropolitan Area: 2019-20.
The release provides annual household expenditures, percentage shares, and selected demographic characteristics for households in the St. Louis area for the period 2019-20.
Regional Commissioner Michael Hirniak noted the following:
Households in the St. Louis, MO-IL, metropolitan area spent an average of $64,389 per year in 2019–20.
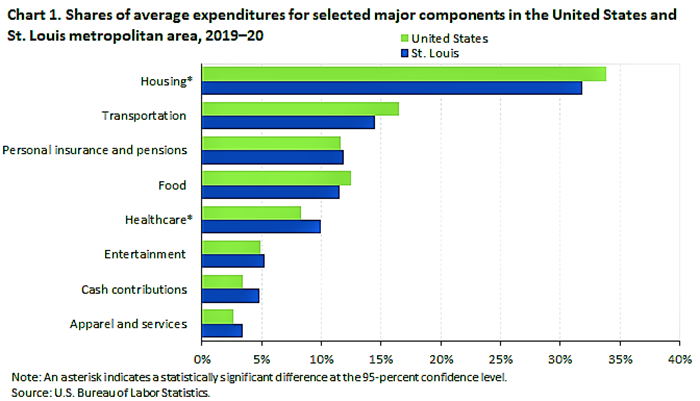
Housing was the largest expenditure component for St. Louis-area households and averaged $20,493. Housing accounted for 31.8 percent of the area’s household budget, significantly lower than the 33.8 percent U.S. average. (See chart 1.)
Healthcare spending accounted for 10 percent of the average household’s budget in St. Louis, significantly higher than the 8.3 percent national average.
Highlights of the St. Louis area’s 2019–20 spending patterns:
- Housing: This was the largest expenditure component for St. Louis-area households and averaged $20,493. Housing accounted for 31.8 percent of the area’s household budget, significantly lower than the 33.8-percent U.S. average. Among the 22 metropolitan areas nationwide for which data were available, St. Louis was 1 of 2 areas with housing expenditure shares that were significantly lower than the national average. Housing expenditure shares among the 22 published metropolitan areas ranged from 39.1 percent in New York to 31.8 percent in St. Louis. (See table 2.)
- Transportation: St. Louis-area households spent 14.5 percent of their budget on transportation, not significantly different from the national average of 16.5 percent. Of the $9,314 in annual transportation expenditures in St. Louis, 95.2 percent was spent buying and maintaining private vehicles; this compared to the national average of 94.9 percent.
- Food: The portion of a St. Louis household’s budget spent on food, 11.5 percent, was not significantly different from the 12.5-percent U.S. average. St. Louis-area households spent $4,375, or 58.9 percent, of their food dollars on food at home and $3,054 (41.1 percent) on food away from home. In comparison, the average U.S. household spent 61.9 percent of its food budget on food at home and 38.1 percent on food away from home.
Additional Information
Data in this release are from the Consumer Expenditure Survey (CE), which the U.S. Census Bureau conducts for the U.S. Bureau of Labor Statistics. The data in this release were averaged over a 2-year period, 2019 and 2020.
A household in the CE survey is defined as a consumer unit which includes families, single persons living alone or sharing a household with others but who are financially independent, or two or more persons living together who share expenses. The terms household or consumer unit are used interchangeably for convenience.
Differences in spending among metropolitan areas may reflect differences in the cost of living, but they also may reflect other causes. Spending differences may result from different consumer preferences or variations in demographic characteristics, such as household size, age, or income levels. However, expenditure shares, or the percentage of a household’s budget spent on a particular component, can be used to compare spending patterns across areas. Sample sizes for the metropolitan areas are much smaller than for the nation, so the U.S. estimates and year-to-year changes are more reliable than those for the metropolitan areas. Users should also keep in mind that prices for many goods and services have changed since the survey was conducted.
A value that is statistically different from another does not necessarily mean that the difference has economic or practical significance. Statistical significance is concerned with our ability to make confident statements about a universe based on a sample. A large difference between two values may not be statistically significant, while a small difference could be significant; both the sample size and the variation among the values in the sample affect the relative error of the estimates.
For additional technical and related information, see https://www.bls.gov/opub/hom/cex/home.htm.